Technology aligned with your priorities.
Business analytics starts with the decisions you need to make. We help identify useful measures, understand where information comes from and shape reporting around the questions your teams actually ask.
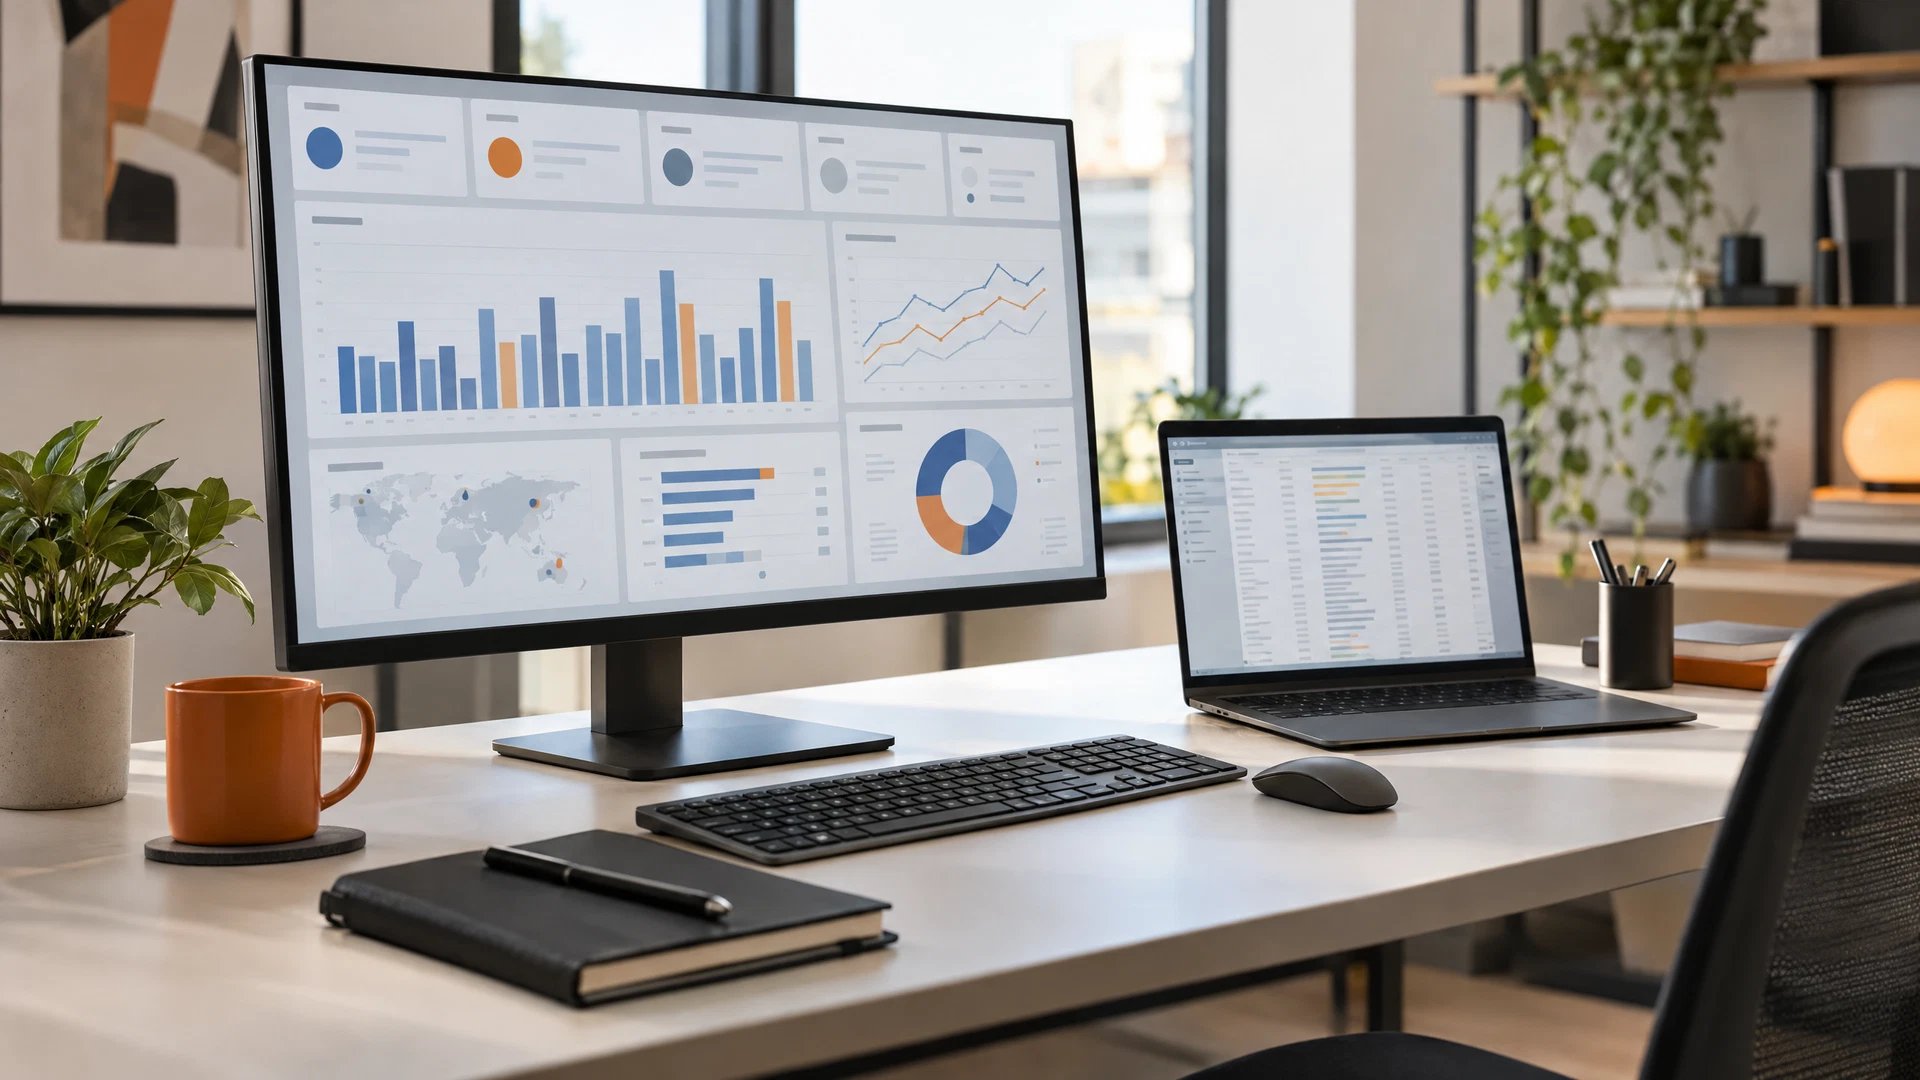
We can support data preparation, business intelligence dashboards and visual reporting that connect information from existing applications. Data quality, consistent definitions, access controls and a clear refresh process help teams understand what the figures mean and where their limitations lie.
For organizations in Canada, we help frame analytics requirements around the business context and applicable data-handling needs. From a focused dashboard to a wider reporting roadmap, the work includes validation, documentation and handover so your team can use and maintain the solution. Platform selection and project scope are confirmed during discovery.
Discuss business analytics and data visualization for your organization in Canada. We confirm scope, delivery arrangements and the needs of your environment during consultation.
How we can help
- Business questions, KPI discovery and reporting requirements
- Data-source assessment, preparation and quality checks
- Business intelligence dashboard design
- Data visualization and management reporting
- Access controls, measure definitions and refresh planning
- Dashboard validation, documentation and team handover